This post looks at Algorithm 39, a clusterwise linear regression method that couples both clustering and linear regression. The algorithm was proposed by Späth in 19791 and the goal of this post is to break down the original paper and look to build a better understanding of the algorithm.
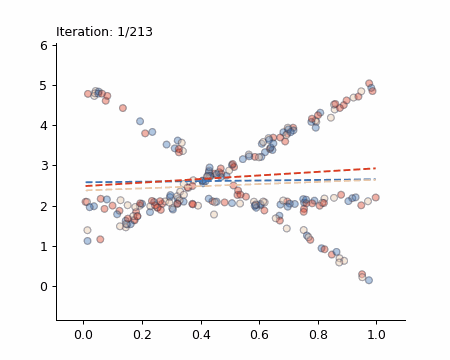
Here is a visualisation of the Späth algorithm in action:
The Simple Case
Spath begins by introducing a problem which most readers will be familiar with. In particular, the problem is to find $(x_1, \dots, x_l)$ that minimises the following objective function:
$$\displaystyle \sum_{i=1}^{m} \left( y_i - \sum_{k=1}^{l} a_{ik} x_k \right)^2$$
where we have m observations $(y_i, a_{ik})$ for $i = 1, \ldots, m$ and $k = 1, \ldots, l$ with $m > l$.
To visualise this problem, we can plot the observations $(y_i, a_{ik})$ as points in the plane.

Here we assume that $m = 100$ and $l = 1$, where $m$ is the number of observations and $l$ is the number of variables. We are going to put this in the form of vectors, which looks like this:
$$A = \begin{bmatrix} a_{11} \\ a_{21} \\ \vdots \\ a_{m1} \end{bmatrix}, \quad \mathbf{y} = \begin{bmatrix} y_1 \\ y_2 \\ \vdots \\ y_m \end{bmatrix}$$
and since we have $l = 1$ we can write the vector of parameters $\mathbf{x}$ as
$$\hat{\mathbf{x}} = \begin{bmatrix} x_1 \end{bmatrix}$$
To generate the same data shown in the visualisation, we can use the following code:
m = 100
l = 1

A = np.random.normal(size=(m, l))
c = np.array([3.0])
y = A @ c + 10 + np.random.normal(scale=1.0, size=m)
Solving this problem is simple and in our case with $m > l$ observations and linearly independent features (we literally have 1 feature in this case since $l = 1$), we can use the following formula:
$$ \begin{align*} \hat{\mathbf{x}} = (A^T A)^{-1} A^T \mathbf{y} \end{align*} $$
where $A \in \mathbb{R}^{m \times l}$ is our matrix with entries $a_{ik}$ and $y \in \mathbb{R}^m$ is the observation vector.
To solve this problem we can use NumPy, and the code for solving for $\hat{x}$ is:
x = np.linalg.inv(A.T @ A) @ A.T @ y
The only thing is missing here is the intercept term, which we can add by adding a column of ones to $A$ which then will give us $\hat{x}$ as:
$$\hat{\mathbf{x}} = \begin{bmatrix} x_1 \\ x_0 \end{bmatrix}$$
where $x_0$ is the intercept term.
This means that we can write the following function to solve the linear regression problem:
def lingress(A, y, intercept=True):
    """
    A: matrix of features
    y: vector of observations
    intercept: whether to include an intercept term
    """
    if intercept:
        A = np.vstack([A.flatten(), np.ones(len(A))]).T
    return np.linalg.inv(A.T @ A) @ A.T @ y
We should almost always include an intercept term when doing linear regression, unless we have strong prior knowledge that the linear approximation is forced through the origin, which in most cases is not the case! For those interested in the details you can read the discussion “When is it ok to remove the intercept in a linear regression model?” which also includes examples of when it is ok to remove the intercept.
While this post isn’t focused on how linear regression works, to understand what I mean by being “forced through the origin” we can plot the solution to our problem with and without the intercept term:

From the figure above we can see obviously why (for our case anyways) we should include the intercept term.
Now the previously defined formula:
$$ \begin{align*} \hat{\mathbf{x}} = (A^T A)^{-1} A^T \mathbf{y} \end{align*} $$
is going to give us a closed-form solution, and closed-form solutions guarantee we’ve found the global minimum of our objective function. But this particular formula will only work when $A$ is full rank, which is not always the case.
For example, if we construct a new matrix $Q$ such that:
$$Q = \begin{bmatrix} a_{11} & 2a_{11} \\ a_{21} & 2a_{21} \\ \vdots & \vdots \\ a_{m1} & 2a_{m1} \end{bmatrix}$$
Then the formula above will not work because the columns of $Q$ are linearly dependent, and so the matrix $Q^T Q$ is not invertible. If you try this yourself in Python you will get a LinAlgError because the matrix is singular.
Q = np.column_stack([A, A*2])
x = np.linalg.inv(Q.T @ Q) @ Q.T @ y
Ok we can now need to define the objective function programatically, and to remind ourselves the objective function is:
$$\displaystyle \sum_{i=1}^{m} \left( y_i - \sum_{k=1}^{l} a_{ik} x_k \right)^2$$
This means we can represent this objective function as:
def obj(y, A, x):
    """
    y: vector of observations
    A: matrix of features
    x: vector of parameters
    """
    cost = 0
    A = np.column_stack([A, np.ones(len(A))])

    for i in range(len(y)):
        preds = 0
        for j in range(len(x)):
            preds += A[i, j] * x[j]
        cost += (y[i] - preds) ** 2
    return cost
I have spelt out the loops explicitly in the objective function. This is not the most efficient way to do this, but it is better for getting a better understanding of the objective function.
For those wondering, the following code gives the same result but with vectorised operations, which is much more efficient:
def obj(y, A, x):
    """
    y: vector of observations
    A: matrix of features
    x: vector of parameters
    """
    A = np.column_stack([A, np.ones(len(A))])
    return np.sum((y - A @ x) ** 2)
Clusterwise Linear Regression
The purpose of this post is to focus on something a bit more interesting than the example above. Instead of solving a single linear regression problem with a single set of parameters, we are interested in solving multiple linear regression problems together.
This involves solving multiple coupled optimisation problems with a combinatorial constraint, where we must decide how to divide our observations among the different subproblems optimally.
Problem Setup
Previously we considered a single linear regression problem with one set of parameters. Now we want to solve multiple linear regression problems, each with its own set of parameters.
We can achieve this by partitioning the observation indices $\{1, 2, \ldots, m\}$ into $n$ non-overlapping, non-empty clusters:
$$\{C_1, C_2, \ldots, C_n\}$$
where each cluster fits its own linear regression model to its subset of observations.
To start, we can create some data to work with, which is similar to the previous example but now with three different linear relationships:
a1 = np.random.uniform(0.0, 1.0, m)
y1 = 4 * a1 + 1 + np.random.normal(0, 0.1, m)

a2 = np.random.uniform(0.0, 1.0, int(m * 0.5))
y2 = -5 * a2 + 5 + np.random.normal(0, 0.1, int(m * 0.5))

a3 = np.random.uniform(0.0, 1.0, int(m * 0.7))
y3 = 0.1 * a3 + 2 + np.random.normal(0, 0.1, int(m * 0.7))

A = np.concatenate([a1, a2, a3]).reshape(-1, 1)
y = np.concatenate([y1, y2, y3])
Here $m$ is still 100, but we have split the data into three clusters. The first cluster has 100 observations, the second cluster has 50 observations, and the third cluster has 70 observations.
If we plot the problem we get the following visualisation:

The figure on the right shows us what happens if we try using the previous closed-form solution. Obviously this is not going to work since a single regression model is not going to be able to model the three different linear relationships.
Objective Function
Now going back to the problem setup, alongside finding partitions $\{C_1, \ldots, C_n\}$, we also need to find parameter vectors $(x_{j1}, \ldots, x_{jl})$ for $\{j = 1, \ldots, n\}$ such that:
$$D(C_1, \ldots, C_n) = \sum_{j=1}^n E(C_j)$$
is minimised, where:
$$E(C_j) = \sum_{i \in C_j} \left( y_i - \sum_{k=1}^l a_{ik} x_{jk} \right)^2$$
with the constraint:
$$|C_j| > l \quad (j = 1, \ldots, n)$$
This just means that each group must have more than $l$ observations. In our specific case with $l=1$, this means each group must have at least 2 observations.
Now to break this down further, we can see that our original simple regression problem is just a special case of the partitioned problem when $n = 1$:
$$\begin{align*} E(C_1) &= \sum_{i=1}^m \left( y_i - \sum_{k=1}^l a_{ik} x_{1k} \right)^2 \ \end{align*}$$
However, for $n > 1$ each group $C_j$ gets its own parameter vector $\mathbf{x}_j$, allowing different linear relationships for different subsets of the data. This means we already know how to solve this part of the problem and now only need to figure out how to solve the partition problem.
The updated objective function in code is:
def obj(y, A, x, C):
    """
    y: vector of observations
    A: matrix of features
    x: vector of parameters
    C: vector of cluster assignments
    """
    cost = 0
    A = np.column_stack([A, np.ones(len(A))])
    for j in range(len(x)):
        cost += np.sum((y[C == j] - A[C == j] @ x[j]) ** 2)
    return cost
The objective function now loops over partitions, computing the previous objective function for each group’s subset of data, then aggregating these group-wise costs.
Large Solution Space
The partition problem is a combinatorial optimisation problem and like many other combinatorial optimisation problems the solution space is very large.
Späth specifically notes that the number of ways to partition $m$ observations into $n$ clusters grows exponentially with $m$, making exhaustive search computationally infeasible.
Here I show the number of ways to partition $m$ up to 30 where $n=3$:

The formula to compute this number is known as the Stirling numbers of the second kind, which is defined as:
$$S(m, n) = \frac{1}{n!}\sum_{k=0}^{n}(-1)^{n-k}\binom{n}{k}k^m$$
You can easily compute this in Python using the following code:
def S(m, n):
    """
    m: number of observations
    n: number of clusters
    """
    s = 0
    for i in range(n + 1):
        s += (-1) ** (n - i) * math.comb(n, i) * (i**m)
    return s // math.factorial(n)
Späth’s Algorithm
To solve this problem, Späth proposes a heuristic algorithm that iteratively improves the partition. This algorithm is a modification of the exchange method, which Späth had previously described in a 1977 paper 2.
Exchange Method
The modification is simply a change to the objective function, which we have already defined. The exchange method is a greedy algorithm that iteratively moves observations between clusters, but only if the move provides the biggest immediate improvement to the objective function.
This approach has limitations, with one being that it lacks permutation invariance, meaning different orderings of the observations can lead the algorithm to different local optima.
Now I will go through the algorithm step by step.
Step 1. Initialisation
We want to choose an initial partition with respect to the constraint:
$$|C_j| > l \quad (j = 1, \ldots, n)$$
This constraint is important because we need to have at least $l$ observations in each cluster. The initial partition is created through random assignment which is computed as follows:
k = 3
l = 1

check = False

while not check:
    C = np.random.randint(0, k, A.shape[0])
    check = np.all(np.bincount(C, minlength=k) > l)
We are assuming here that there are 3 different linear relationships in the data (because we created the data that way). To see how this looks, we can plot this random initialisation:

With our initial partition, we can compute the parameter vectors $(x_{j1}, \ldots, x_{jl})$ by solving a single linear regression problem for each group:
def find_x(A, y, C, k=3):
    """
    A: matrix of features
    y: vector of observations
    C: vector of cluster assignments
    k: number of clusters
    """
    x_list = []
    for j in range(k):
        Aj = A[C == j]
        yj = y[C == j]
        x_list.append(np.linalg.inv(Aj.T @ Aj) @ Aj.T @ yj)
    return x_list
x = find_x(A, y, C)
Then we can plot the fitted lines for each group:

Step 2. Iterative Improvement
To iteratively improve the partition, we step through each observation by setting $i := i_0$, then incrementing $i := i + 1$ at each step. When we reach to the end of the observations such that $i > m$, we wrap around to $i := 1$ and continue.
This process creates a cycle:
$$i_0 \to i_0+1 \to \cdots \to m \to 1 \to 2 \to \cdots$$
Whenever a beneficial move is found for observation $i$, the algorithm immediately makes that move and continues to the next observation. Otherwise, it simply moves to the next observation.
The cycle is implemented in the following code:
i = 0
while i < m:
    i = (i + 1) % m
and if we run this cycle for 300 runs:
cycles = []
runs = 0
i = 0

while i < m:
    i = (i + 1) % m
    runs += 1
    cycles.append(i)

    if runs > 300:
        break
we get the following visualisation of the cycle:

What I like about this visualisation is that it shows the cycle through the observations. This actually gives us a good insight into the algorithm. We know that the heuristic is greedy and makes immediate decisions based on the current state.
This means that the algorithm is going to be very sensitive to the order of the observations. If we change the order of the observations, we will get a different solution.
Späth does call this limitation out in the paper:
This method is stepwise optimal and works sequentially on the observations. Its result depends on the initial partition.
His recommendation is to start with several initial partitions and to select the best solution. Exactly like the multi-start heuristic we discussed here.
Step 3. Stopping Criterion
This step repeats step 2 until the objective function stops improving. Specifically, we continue as long as beneficial moves are found, and stop when we’ve seen $m$ consecutive observations without finding any improvement.
The improvement condition is:
$$E(C_p \cup \{i\}) + E(C_j \setminus \{i\}) < E(C_p) + E(C_j)$$
This checks if the total error of the two affected clusters decreases after moving observation $i$ from cluster $C_j$ to cluster $C_p$. The left side represents the error after the potential move:
$$C_j := C_j \setminus \{i\}, \quad C_p := C_p \cup \{i\}$$
If this move reduces the total error, we confirm it by updating the cluster assignments. Otherwise, we continue to the next observation.
Complete Algorithm
Now we can put all the steps together to create the complete algorithm for solving our clusterwise linear regression problem.
We will start by first defining a few helper functions:
def subset_obj(y, A, x):
    """
    y: vector of observations
    A: matrix of features
    x: vector of parameters
    """
    A = np.column_stack([A, np.ones(len(A))])
    return np.sum((y - A @ x) ** 2)

def cur_obj(y, A, C, i, p):
    """
    y: vector of observations
    A: matrix of features
    C: vector of cluster assignments
    i: index of observation
    p: index of cluster
    """
    x = lingress(A[C == C[i]], y[C == C[i]])
    c_obj = subset_obj(y[C == C[i]], A[C == C[i]], x)

    x = lingress(A[C == p], y[C == p])
    c_obj += subset_obj(y[C == p], A[C == p], x)
    return c_obj

def new_obj(y, A, C, i, p, Cp):
    """
    y: vector of observations
    A: matrix of features
    C: vector of cluster assignments
    i: index of observation
    p: index of cluster
    Cp: vector of cluster assignments after move
    """
    x = lingress(A[Cp == C[i]], y[Cp == C[i]])
    n_obj = subset_obj(y[Cp == C[i]], A[Cp == C[i]], x)

    x = lingress(A[Cp == p], y[Cp == p])
    n_obj += subset_obj(y[Cp == p], A[Cp == p], x)
    return n_obj
The reason we need these helper functions is because we must compute the objective function for specific subsets of the data, rather than the entire dataset.
Both the current and new objective functions are used to compute the improvement in the objective function when moving observation $i$ from cluster $C_j$ to cluster $C_p$.
def iterative_improvement(A, y, C, k, l=1):
    """
    A: matrix of features
    y: vector of observations
    C: vector of cluster assignments
    k: number of clusters
    l: minimum number of observations per cluster
    """
    m = A.shape[0]
    i = m - 1

    while True:
        improved = False

        for _ in range(m):
            i = (i + 1) % m

            if np.sum(C == C[i]) <= l + 1:
                continue

            best_p = None
            improvement = 0

            for p in range(k):
                if C[i] == p:
                    continue

                Cp = C.copy()
                Cp[i] = p

                c_obj = cur_obj(y, A, C, i, p)
                n_obj = new_obj(y, A, C, i, p, Cp)

                r = c_obj - n_obj

                if r > improvement:
                    improvement = r
                    best_p = p

            if improvement > 0:
                C[i] = best_p
                improved = True

        if not improved:
            break

    return C
By running this complete algorithm we will get the following visualisation:

If you refer back to the initial visualisation (the animated gif) you will see that these results are different. That is because the algorithm is not deterministic due to the random initialisation.
This means we can run the algorithm multiple times and select the best solution, but before we do that we can first put together the initialisation function:
def initialise(A, k, l):
    """
    A: matrix of features
    k: number of clusters
    l: minimum number of observations per cluster
    """
    check = False

    while not check:
        C = np.random.randint(0, k, A.shape[0])
        check = np.all(np.bincount(C, minlength=k) > l)
    return C
Now we can run this for 100 runs and get some simple statistics:
k = 3
l = 1

history = []

for _ in range(100):
    C = initialise(A, k, l)
    C = iterative_improvement(A, y, C, k, l=1)
    x = find_x(A, y, C)

    history.append(obj(y, A, x, C))
We can first check the minimum and maximum values:
print(f"Min: {np.min(history):.2f}")
print(f"Max: {np.max(history):.2f}")
Min: 1.75
Max: 14.80
This means that our best solution is 1.75 and our worst solution is 14.80 which is a large difference. This is why it is good to run this algorithm multiple times.
But another thing we can check is the mean, standard deviation and coefficient of variation:
mean_obj = np.mean(history)
std_obj = np.std(history)
cv = std_obj / mean_obj
Which gives us:
print(f"Mean: {mean_obj:.2f}")
print(f" Std: {std_obj:.2f}")
print(f"  CV: {cv:.2f}")
MEAN: 4.49
 STD: 5.31
  CV: 1.18
The coefficient of variation is 1.18 which is quite high, what this means is that the standard deviation is quite large relative to the mean (118% of the mean). However, this isn’t anything new and is a result of having random initialisations.
Closing Thoughts
The algorithm is quite simple and easy to implement once you understand how to formulate the problem. It is very similar to $k$-means clustering, but instead of using the mean of the observations in each cluster, we use the parameters of the linear regression model but because it is so similar to $k$-means clustering, it is very easy to get confused and program it incorrectly.
The first time I tried to implement it, I made the mistake of using the mean of the observations in each cluster, then fitting a linear regression model to each cluster. This is incorrect because the mean is not the best way to fit a linear regression model to the data.
While an obvious mistake, these types of mistakes are easy to make.. well for me at least!
-
Späth, H. (1979). Algorithm 39 Clusterwise linear regression. Computing, 22(4), 367–373. https://doi.org/10.1007/bf02265317 ↩︎
-
Späth, H. (1977). Computational experiences with the exchange method: Applied to four commonly used partitioning cluster analysis criteria. European Journal of Operational Research, 1(1), 23–31. https://doi.org/10.1016/S0377-2217(77)81005-9 ↩︎